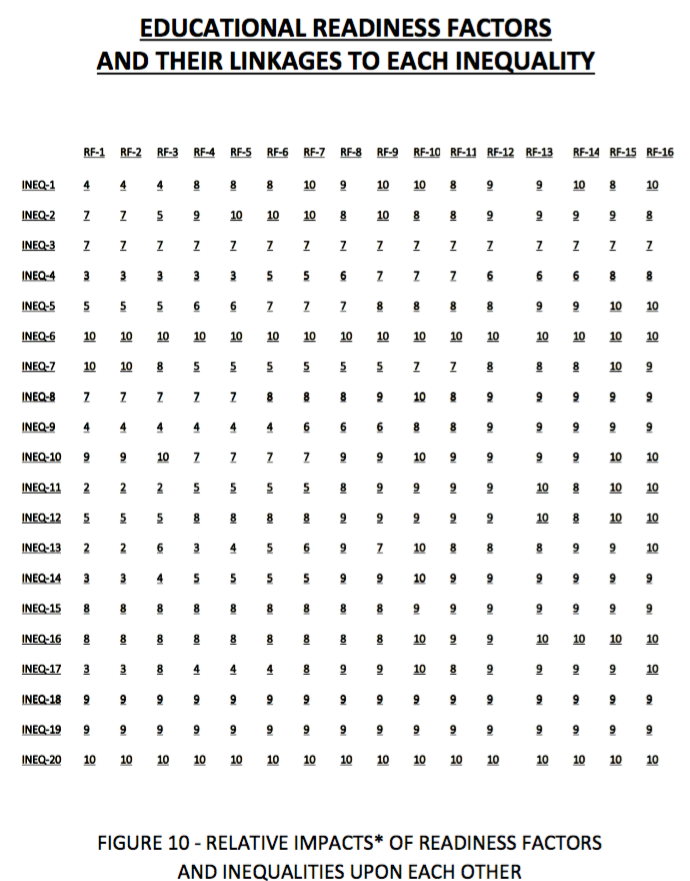
Figure 10: Educational Readiness Factors and Their Linkages To Each Inequality
Definition: As noted previously, there is a critical relationship between poverty-driven inequalities and their impact upon that preparation and readiness so necessary for a meaningful education. Coupled with the relationship between the lack of a meaningful education and imbedded risk of entry into a life of poverty, there is a necessity to model the dynamic and two-way relationship between educational readiness factors and poverty-driven inequalities. The rationale for this approach is that education is the main highway out of poverty and that readiness for learning [and teaching] throughout any educational process enables a meaningful educational journey as well as the mitigation of poverty-driven inequalitites!
Description: Figure 10 provides some interesting insight into the unique linkage between the chain of educational readiness factors and the spectrum of poverty-driven inequalities. Although the weights for each element are depicted as constant values, each element weight could have variations in time and site-specific characteristics. The individual elements strongly infer [1] that an inequality factor is not a one-to-one function of a particular readiness factor but rather impacts a composite function of not only a family of readiness factors but, indeed, all of them and [2] that, conversely, each readiness factor is in a similar relationship with all of the inequalities to some degree.
The element values could have either a positive [+] value or a negative [-] value indicating the 'intensity' or 'strength' of a constructive [+] or destructive [-] relationship between each readiness factor and each inequality. The message of Figure 10 is to enhance the awareness that we are dealing with a complex and convoluted situation.
Keywords: Readiness measurement, readiness assessment, inequality measurement, inequality assessment, composite assessment of poverty and inequality, site-specific readiness and inequality assessment, assessment metrics for composite functions, assessment range, metrics for pilot programs, metrics for program planning, feasibility of this methodology, application of this methodology, assessment risk.
Selected references:
1. So Rich, So Poor, Peter Edelman, The New Press, New York, 2012.
2. A New Model for Ending Inner City Poverty: An Interview with Ted Howard, Senior Fellow for Sicial Justice, Cleveland Foundation, Neil Edington, Social velocity, June 25, 2012.
3. Core Indicators, The Annie E. Casey Foundation: 34% of Hispanic or Latino children lived in poverty in 2011.
4. Rhode Island KIDSCOUNT Factbook, 2012, 2013 Annual Publications.
5. National Center of Children in Poverty [NCCP], Mailman School of Public Health, Columbia University.
6. Poverty & Despair versus Education & Opportunuity, Chapter V: Poverty, Education and Their Linkages, Learning and Teaching Readiness, Al Colella, Joseph H. Crowley, Stillwater River Publishers, 2016.
Poverty-Inequalities - A Complex and Convoluted Situation: Figures 10a, 10b and 10c
Description: The Figure 10 spreadsheet and its description above is the genesis for the graphics of Figures 10a, 10b and 10cand, then, Figures 10d, 10e and 10f. These graphics [1] highlight the connectivity, complexity and convoluted nature of the real world of poverty and [2] reveal the utility of dashboard versions of Figure 10 as a unique and effective assessment and performance tracking tool. First, the 16 readiness factors [Figures 7 and 8] and the 20 inequalities [Figure 9] are put into [1] some circular graphics and, then, [2] some dashboard graphics. Figure 10a shows a single connection between one readiness factor [RF-1]and one inequality factor [IN-1], aka[ INEQ-1], [IN-2=INEQ-2], etc., and represnts a single cell of the 320 cells of Figure 10. Figure 10b shows twenty connections from a single readiness factor [RF-11] to all 20 factors of inequality [IN-1,..., IN-20]. Figure 10c, then, shows the total connectivity of the 320 cells of Figure 10; it also reflects the complexity and convoluted nature of the poverty arena as it relates to education. The role of these connectivity and dashborad versions of Figure 10 follow:
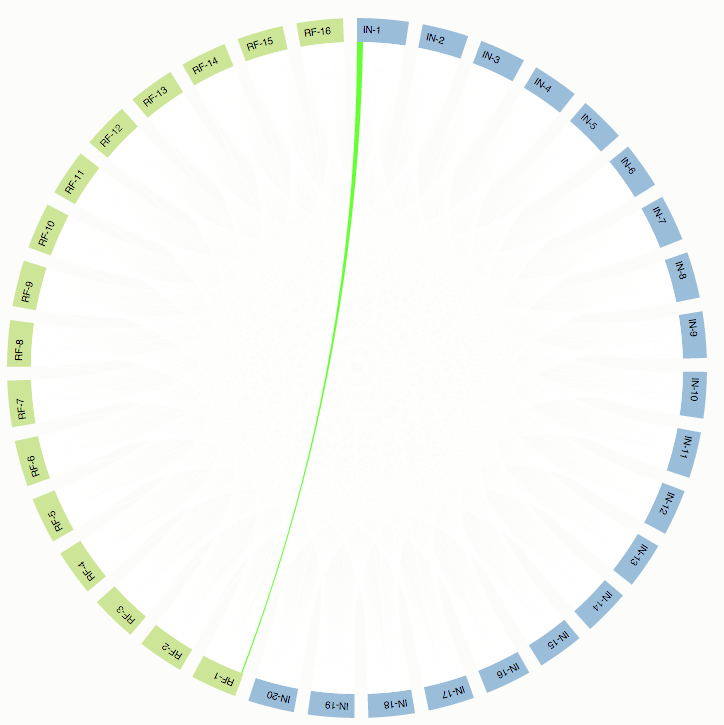
Connectivity between [RF-1] and [IN-1]; [IN-1] = [INEQ-1]
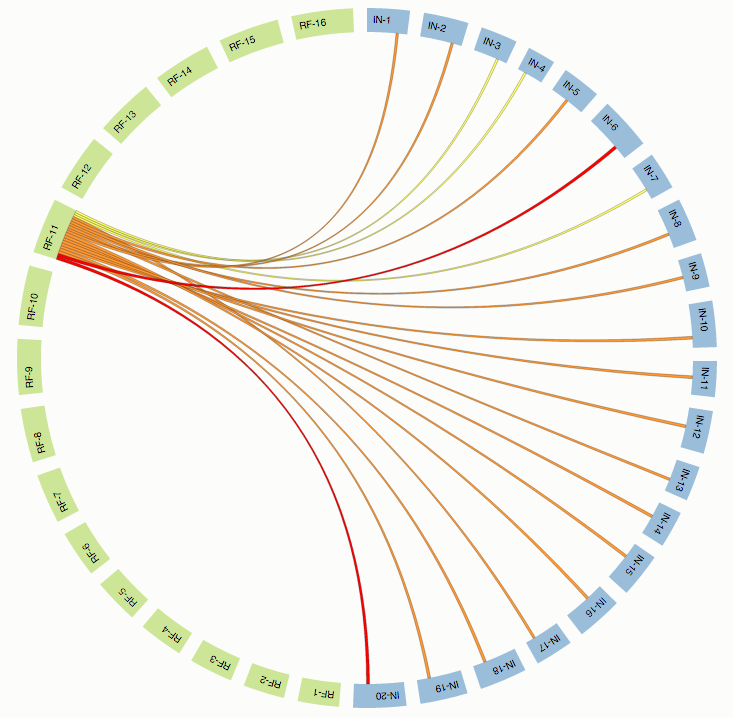
Connectivity between [RF-11] and all 20 [INEQ] factors, i.e., [INEQ-1], [INEQ-2],...[INEQ-20].

Connectivity between all 16 RF Readiness Factors and all 20 INEQ Factors.
Poverty-Inequalities - Dashboard Graphics: Figures 10d, 10e and 10f
Description: Referring to the spreadsheet data of Figure 10, it is interesting to note that the educational readiness factors, when realized and increasingly positive [+], could decrease the intensity/strength of each of the poverty-driven inequalities of Figure 9. However, as noted previously, this spreadsheet [or its equivalent] is really a two-way street. The inference is that an equivalent version of the spread sheet could also reflect the education-driven reduction, minimization or, ideally, the elimination of those poverty-driven inequalities. The challenge, then, is to reverse the mastery of the long-imbedded inequalities over the entire educational process and to plan, develop, evaluate and implement a strategy for the mastery of the educational process over the impact of poverty-driven inequalities.
Current Representative Specific Site Assessment of the Intensity/Strength of Each of the Poverty-driven Inequalities Upon Educational Readiness Factors.
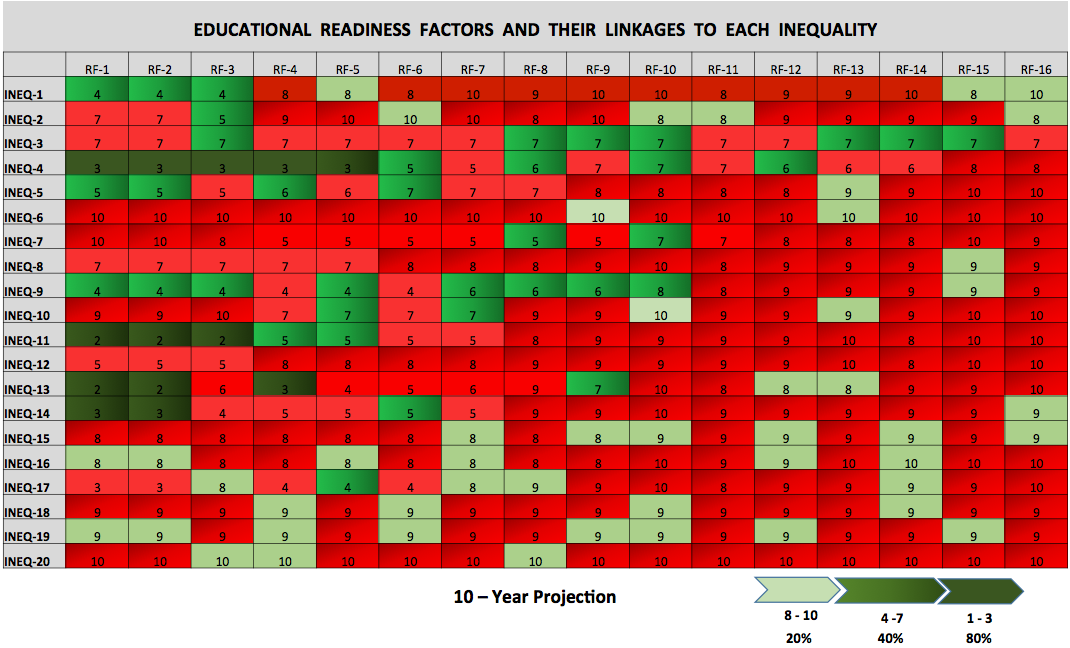
10e: Ten Year Projection of the Transformation from Negative [Red] Impacts to Positive [Green] Impacts.
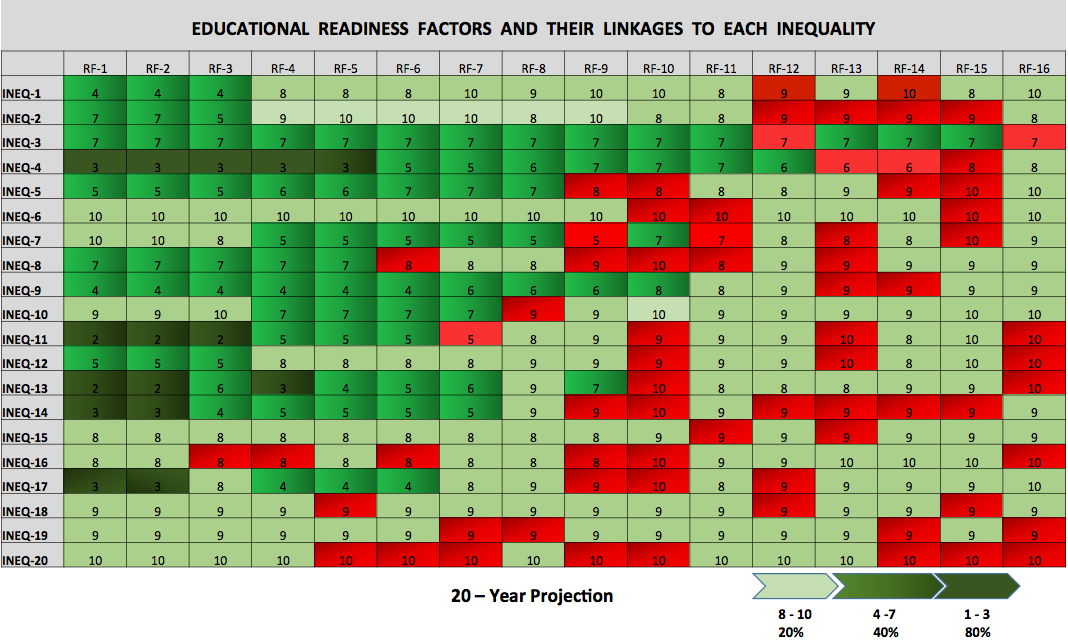
10f: Twenty Year Projection of the Further Transformation from Negative to Positive Impacts.
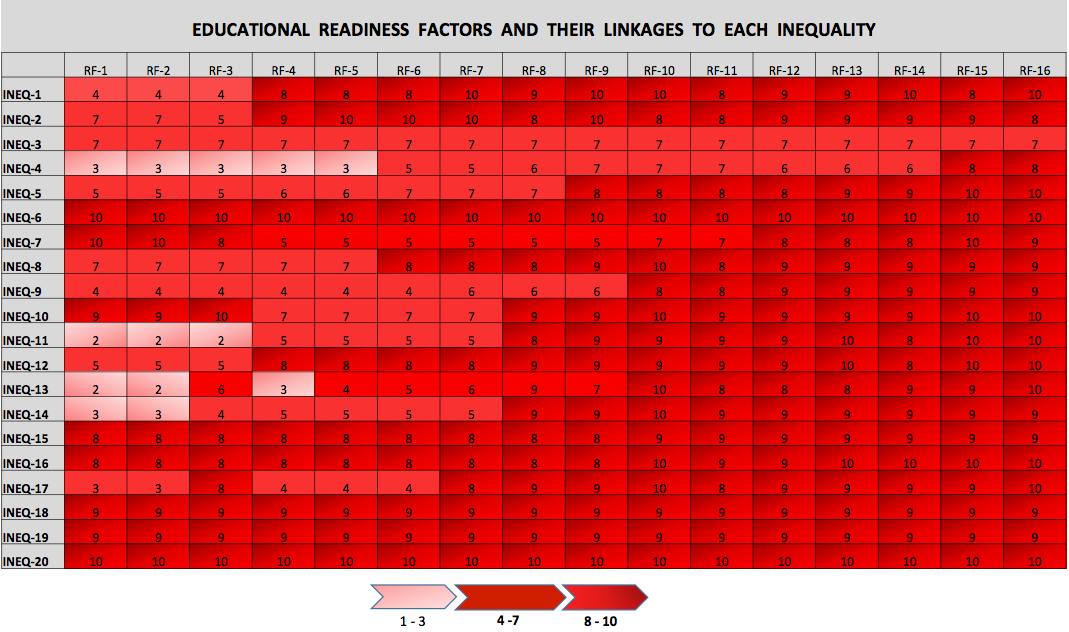
Whereas the spreadsheet format of Figure 10 is for a specific point in time at a specific site, dashboard versions are a dynamic assessment metric that can also be a tracking tool for changes over a timeline of years and, perhaps, decades, in direct response to program and policy initiatives. Basically, these three dashboard versions readily reflect 'What's working?' and, of equal importance, 'What's not working?' Two very critical factors for complex systems with a long life! Each factor is a much-needed and valued input to both the management process and the all-important budgeting process. Figure 10d shows the individual element values for the impact distributions as shown. Let's identify all shades of red [light, medium dark] as being negative [-], i.e., destructive, impacts, and, forthcoming, shades of green [light, medium, dark] as [+], i.e., constructive, impacts. Figure 10d represents current conditions; Figure 10e provides an [estimated] 10-year projection and Figure 10f provides a 20-yeat projection. A cursory analysis of these graphics shows that the following questions can be answered: "What's working?', 'How well is it working?', 'What is not working?', 'What is not changing at all?' and 'What is worsening?' Impact values provide weighted answers.
In Poverty & Despair versus Education & Opportunity, the authors have provided relevant insight to the costs associated with 'prepared' students and the costs associated with 'unprepared' students. For example: "The costs associated with the education of the 'unprepared' - and those outcomes that result directly from their 'unpreparedness' - are increasing [perhaps, exponentially] with the passage of time. These costs do have a marginal, but temporary, positive impact but, for the most part, are really 'maintenance costs for the staus quo [aka 'business as usual']. Specifically, the return on these costs for the 'unprepared' are minimal [compared to the return on the investment costs for the 'prepared'."
Finally, the authors have noted - more than several times - that for poverty, a situation that has developed and persisted over decades, will not be successfully overcome in the near future but rather within a time frame of years compared to the decades of existence of poverty. It follows that effective and credible assessment tools are required to complement plans, initiatives, programs and policies proposed and implemented within this time frame of years. This latter requirement infers budgeting policies and commitments within that same time frame. Of course, an integral part prerequisite for implementation is the established of the feasibility of a candidate strategy; this feasibility begins with a real-world working model known as a site-specific pilot model-the evaluation of which mandates the availability and relevance of meaningful metrics, e.g., these dashboard versions or their equivalent. The next three sections address the triad of 'costs of poverty',site-specific pilot programs and some choices to be made.